

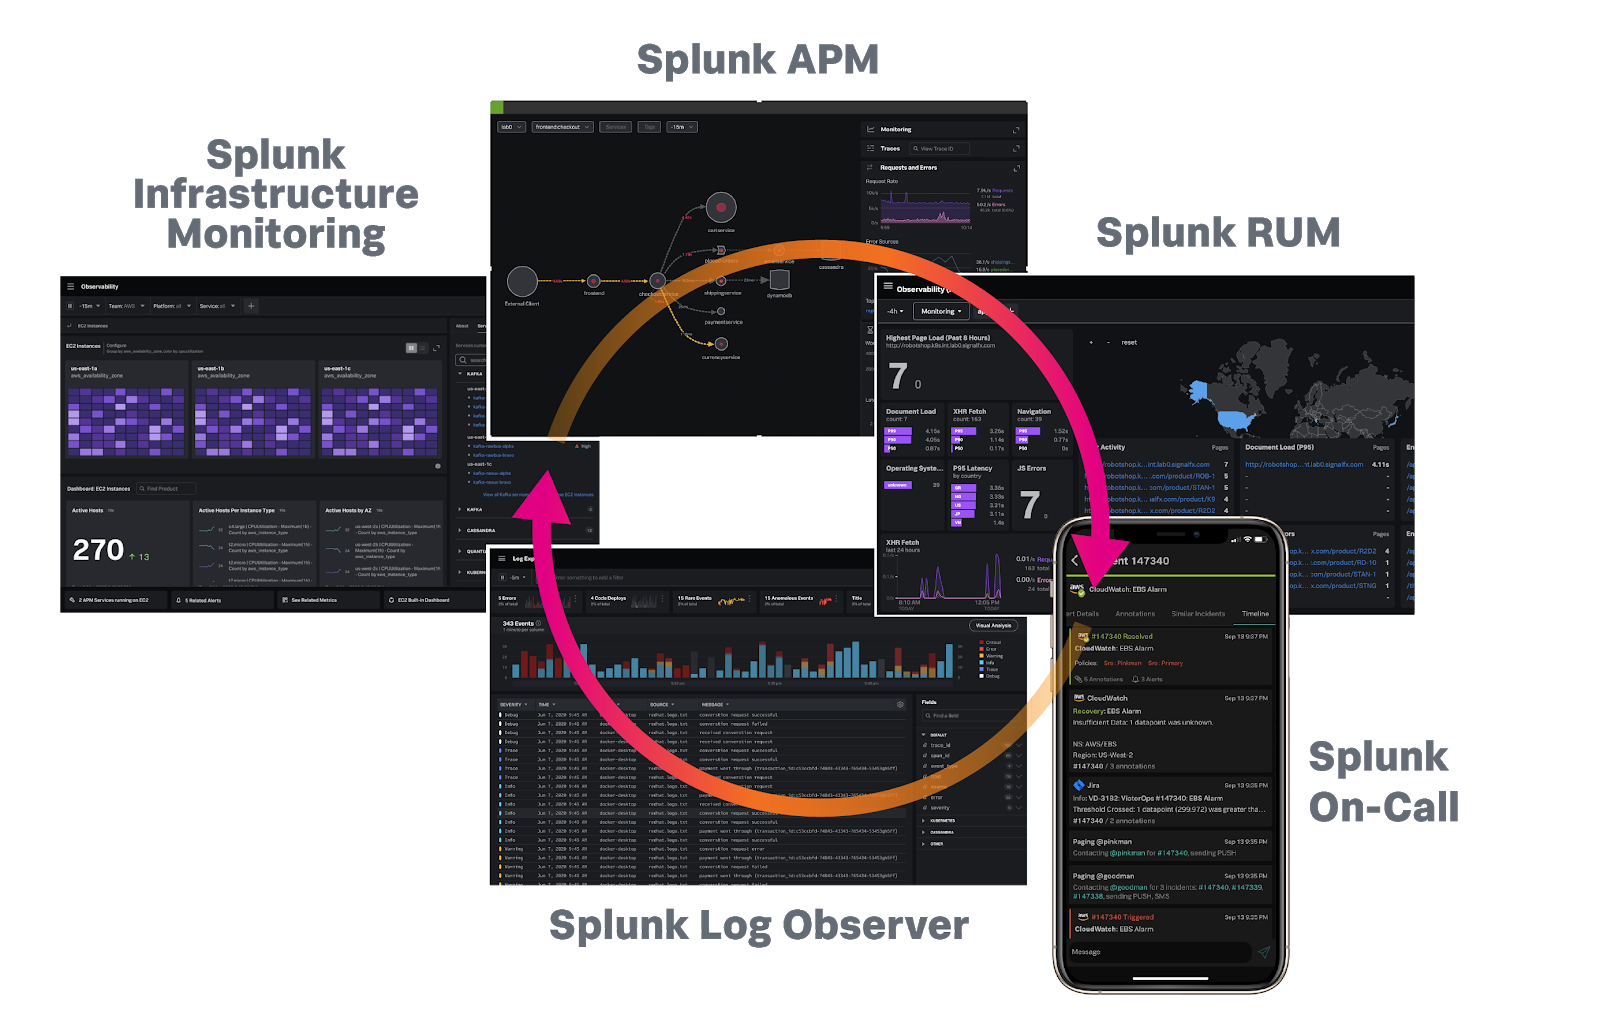
Splunk Observability Cloud: Six Months That Changed the Game
From agentic AI to a redesigned APM experience — here's what's landed, what it means, and what to watch next.

There’s a version of the Splunk Observability Cloud story that reads like a slow-burn platform maturation. And then there’s what happened in just the last six months.
Between November 2024 and May 2026, Splunk shipped a relentless cadence of updates — AI agents, a complete service map redesign, deep Kubernetes troubleshooting overhauls, runtime security embedded directly into APM, and an entirely new way to understand user behaviour. If you haven’t been tracking the release notes closely, you’ve missed a lot. This article is the catch-up.
I’ve pulled directly from the official release notes and the Splunk Community What’s New posts to give you a grounded, practitioner-level view.
The Big Picture: Three Shifts Driving Everything
Before diving into the individual features, it’s worth naming the three structural shifts that explain why these features are being built:
1. Cisco’s influence is accelerating. The AppDynamics convergence is no longer just a roadmap slide. Deep linking, hybrid APM, shared dashboarding, and unified identity are all actively shipping. The “one platform” vision is becoming tangible.
2. AI is moving from assistant to agent. The AI assistant launched in late 2024 as a chat interface. By early 2026, Splunk had shipped autonomous troubleshooting agents capable of correlating signals, generating root cause analysis, and recommending remediation — all without a human running the analysis.
3. The platform is expanding its surface area. Observability Cloud used to be where you sent your OTel data. Now it’s where you monitor your AI models, run your digital experience analytics, manage your security posture, and manage your organisational cost. That’s a materially different product.
The New UI: A Quietly Important Change
Often underplayed in marketing announcements but consequential for daily users — the navigation and homepage received a significant overhaul in the last 18 months. The November 2024 release introduced a modernised top navigation bar with a new user profile menu and a more accessible left navigation panel, bringing AppDynamics and Splunk Observability into a visually unified experience.
That work continued. By September 2025, Splunk introduced the Observability Navigator — a redesigned left nav that organises access around typical engineering workflows, with frequently-accessed items at the top, core full-stack observability in the middle, and data management and settings at the bottom. For teams onboarding new engineers, this kind of discoverability improvement is underrated. Who knows where else we may see this new navigation style develop.
The homepage was also transformed by July 2025 to include alert trend history, recent dashboards, favourite dashboards, and product update links — turning it from a static launchpad into something that actually reflects your environment’s health at a glance.
APM Gets Its Biggest Redesign in Years
If there’s one area where the release cadence has been relentless, it’s Application Performance Monitoring.
Service Map Redesign
The March 2025 release notes introduced a full redesign of the service map. The goal: give engineering teams a holistic view of a service within the broader environment, making error source identification and latency attribution faster. Service map grouping — which visually clusters related services by indexed span tags — shipped alongside this, aligning the view with how teams actually organise their work rather than how the data happens to flow.
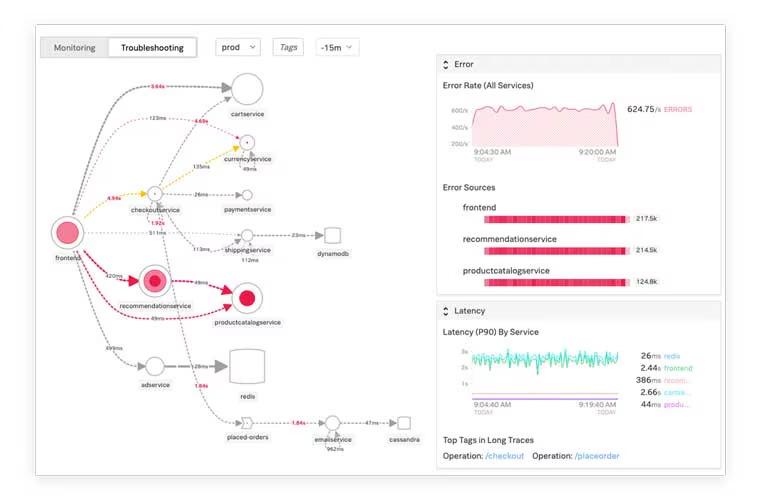
Service-Centric Navigation
Also in March 2025, APM’s service-centric views became more prominently featured on the landing page. You can now understand service health without needing to drill down — the service view surfaces error-based troubleshooting context immediately, so you can identify root causes without manually indexing span tags or digging through traces.
Business Transactions & Call Graphs
By September 2025, Splunk shipped Business Transactions — a way to group traces that represent discrete user flows (think: user registration, add to cart, checkout). Instead of a sea of microservice spans, you get meaningful business processes you can watch and alert on.
Call Graphs — delivering code-level insights for faster root cause analysis — arrived alongside this, completing a set of capabilities that genuinely close the gap between what AppDynamics has long offered for n-tier environments and what cloud-native teams need in Observability Cloud.
By March 2026, Call Graphs got a summary view showing the top five methods consuming the most execution time at-a-glance, dramatically cutting the time needed to identify performance bottlenecks. The ability to exclude specific packages (like third-party library methods outside your control) was added too — a detail that practitioners will appreciate enormously.
ThousandEyes Integration
A first for the ecosystem: the May 2025 release delivered the Splunk APM & ThousandEyes integration. ThousandEyes users can now view application traces from Splunk APM in context, allowing teams to quickly determine whether an incident originates in the network or the application. The classic blame game between networking and application teams just got harder to play — the evidence is now in one place.
Kubernetes: From Navigator to Proactive Troubleshooting
Kubernetes monitoring has seen wave after wave of investment. Here’s the arc:
March 2025: The classic Kubernetes Navigator UI was retired. If you were still using it, this was your migration moment.
June 2025 (release notes): The Kubernetes Navigator gained an Overview tab for nodes and pods, a new K8s Events tab (requiring Log Observer Connect), and enhanced faceted filtering. New control plane dashboards also arrived.
August 2025 (community post): Overview tabs landed for Containers, Workloads, Namespaces, and Clusters aggregate pages, with refreshed charts and improved organisation.
The theme is consistent: every release makes Kubernetes environments easier to navigate and faster to triage. For SRE teams, these aren’t cosmetic changes — they’re time-to-resolution improvements.
AI: From Chat Interface to Autonomous Agent
This is the story with the most dramatic arc.
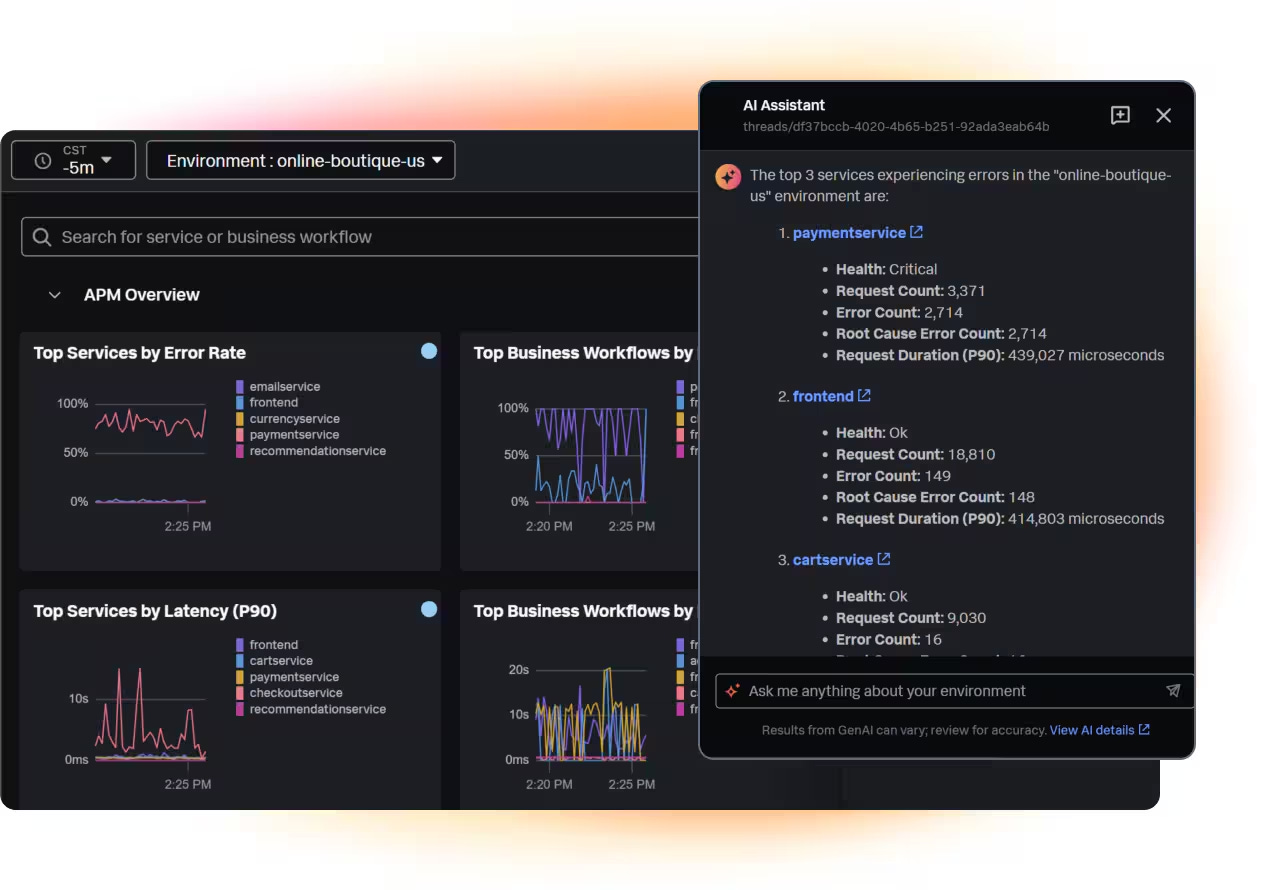
The AI Assistant (early 2025)
The AI Assistant in Observability Cloud launched as a GenAI-powered in-product chat but only in some regions. Engineers could ask natural language questions and get insights about their systems without needing deep Splunk expertise. A meaningful reduction in MTTD and MTTI for less-experienced team members.
AI Assistant Expands to RUM (March 2026)
By March 2026, the AI Assistant reached Real User Monitoring, letting teams investigate frontend performance, JavaScript errors, and user behaviour in plain language — asking questions across apps, metrics, tags, and time windows without writing a single query.
The Troubleshooting Agent (Q1 2026)
This is the one that changes the role of the on-call engineer. The AI Troubleshooting Agent doesn’t just surface anomalies — it automatically correlates metrics, events, logs, and traces; generates evidence-backed root cause summaries; assesses immediate impact on affected services and user sessions; and produces a human-verified remediation plan. All in plain language.
The implication: the on-call engineer’s job shifts from data gathering to decision-making. Whether you see that as progress or risk reduction depends on your perspective, but it’s directionally significant for how organisations will staff and train their observability practices.
The Splunk MCP Server (GA, early 2026, but still undergoing change)
For teams building AI agents of their own: Observability Cloud capabilities are now available on the Splunk MCP Server. This provides a secure, scalable interface for connecting AI assistants and intelligent systems to Observability Cloud data — enabling custom AI workflows and production debugging without leaving your development environment.
AI Infrastructure Monitoring: Observing the Observer
This one deserves its own section because it reflects a genuinely new category of problem.
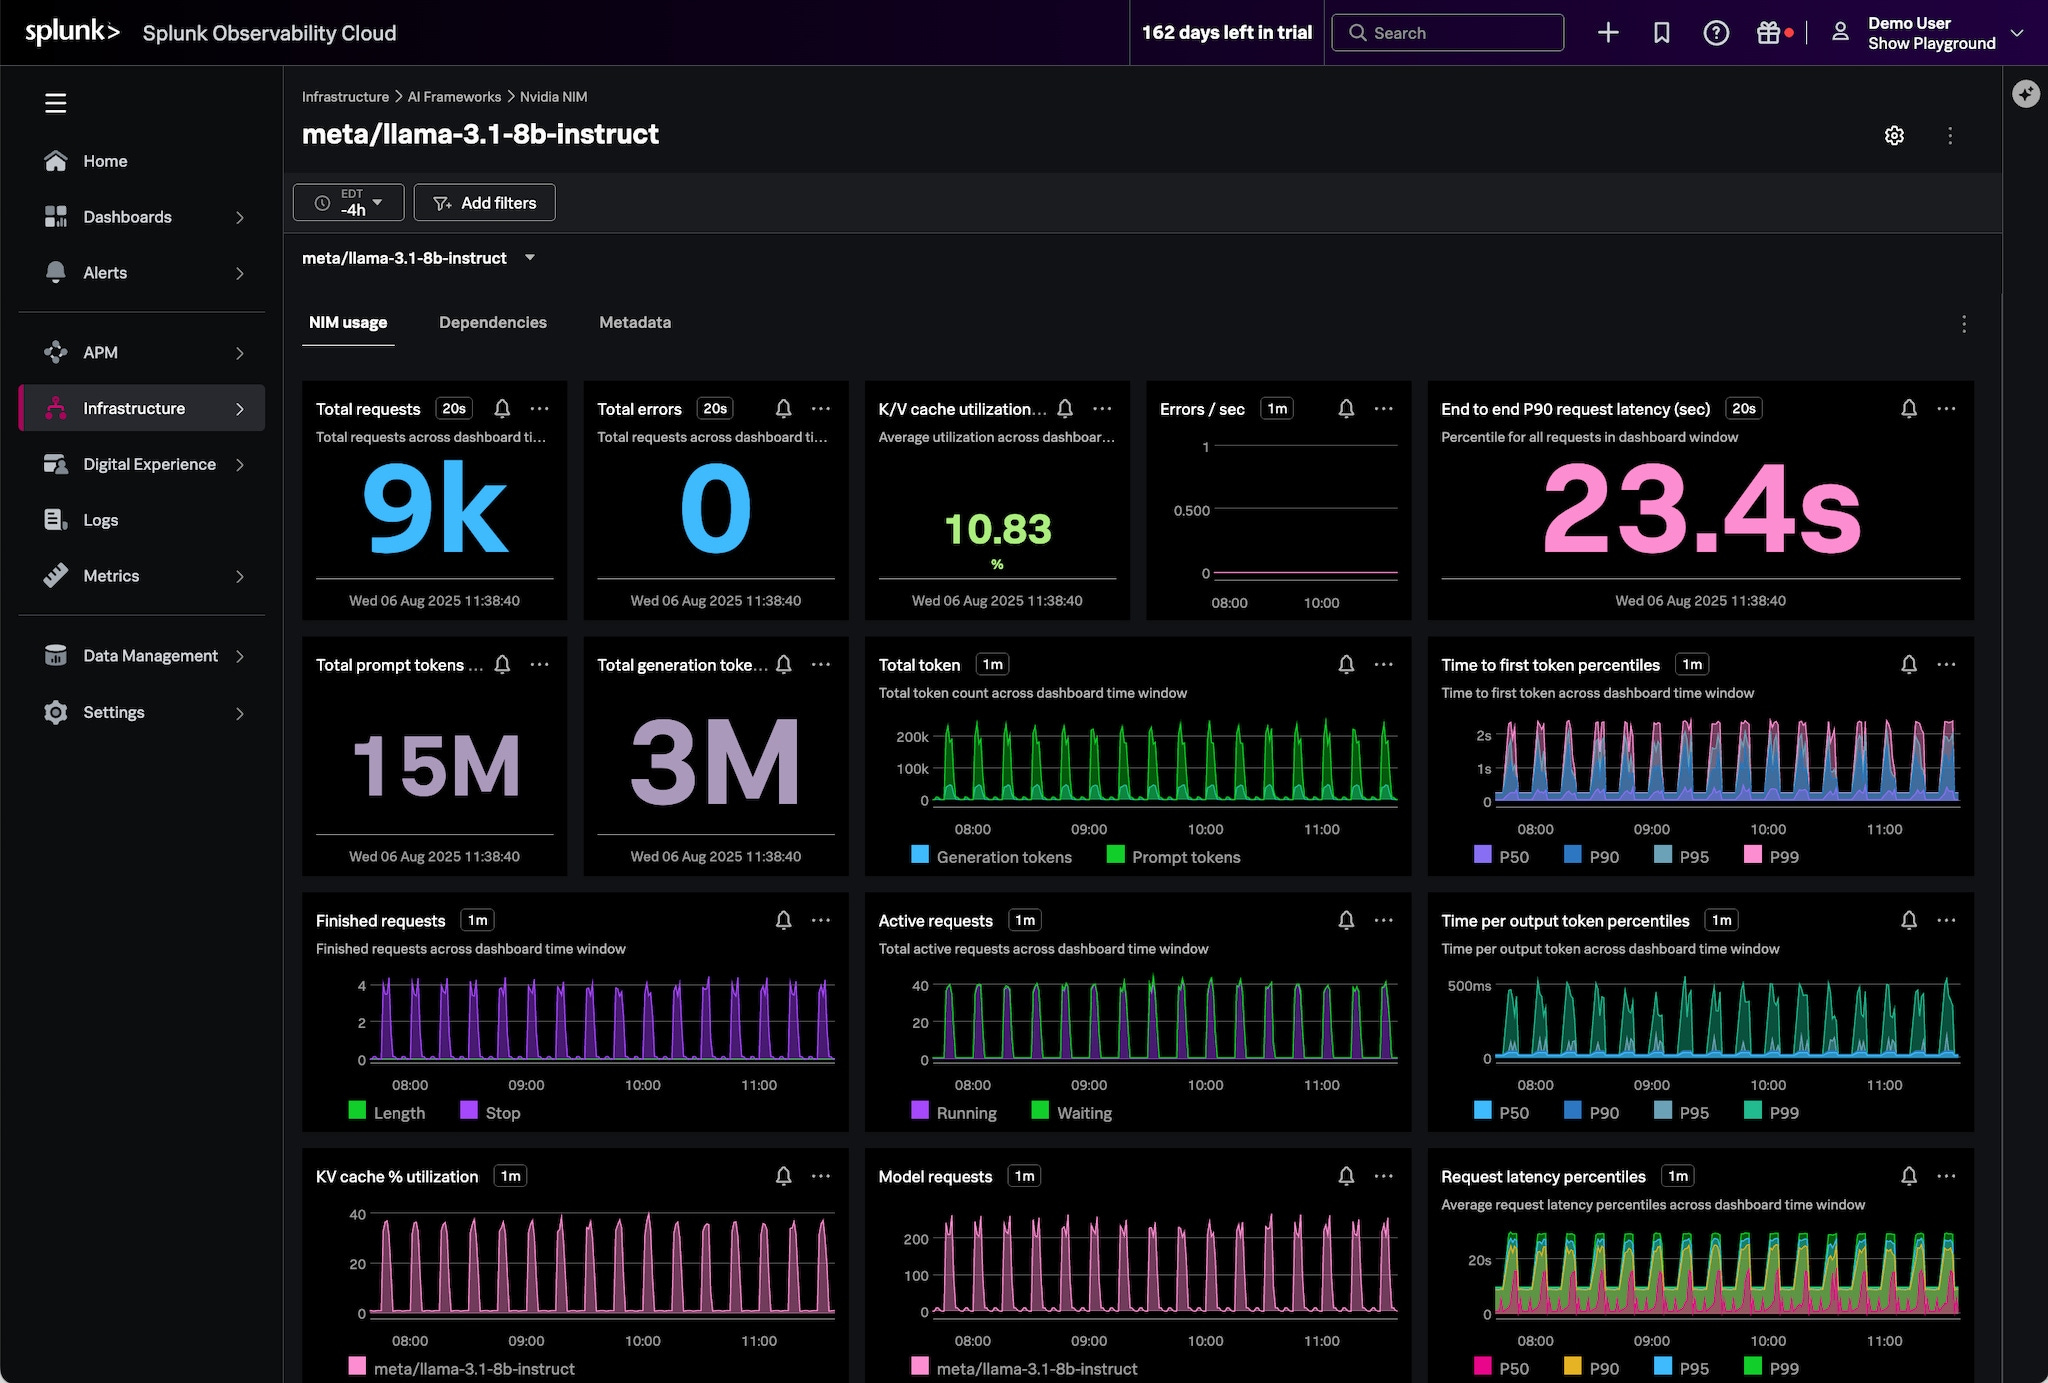
As organisations run LLMs and AI agents in production, the infrastructure supporting those workloads requires a different kind of observability. Splunk’s answer is AI Infrastructure Monitoring, now generally available, which provides dashboards and detectors for orchestration frameworks, model providers, vector databases, and GPUs.
By November 2025, the supported ecosystem included Nvidia NIMs, Milvus and Pinecone vector databases, LiteLLM proxy services, GCP VertexAI, Cisco AI PODs, and more. The metrics tracked include “tokenomics” — time-to-first token, estimated token costs, throughput, GPU utilisation. These are new KPIs for a new class of infrastructure.
AI Agent Monitoring went GA in February 2026, covering performance metrics (latency, errors), quality metrics (hallucinations, bias, drift, accuracy), and cost metrics (token usage). The integration with Cisco AI Defense adds a compliance and security layer — detecting prompt injection, PII leakage, and policy violations in real time.
Digital Experience Analytics: Closing the UX Gap
Traditional RUM tells you what broke. Digital Experience Analytics tells you how users behaved — where they dropped off, what they clicked, what they ignored.
The journey from Alpha to GA happened over several months. By March 2026, Digital Experience Analytics went generally available, enabling teams to track feature usage, visualise user journeys, monitor conversions, and surface friction that impacts business outcomes.
Mobile Session Replay (GA from August 2025) complements this — providing a visual representation of user interactions as either a video or wireframe, paired with rich mobile session metadata. The combination of quantitative signals and session replay closes the loop between engineering, UX, and product teams in a way that previously required separate tooling.
All of this runs through a single, lightweight OpenTelemetry instrumentation agent — a meaningful differentiator given how much complexity multi-agent observability stacks introduce.
Secure Application: Security Lands in the APM Map
Runtime security has historically lived outside observability tooling — in a separate RASP agent, a separate dashboard, a separate team. Splunk is deliberately collapsing that boundary.
Secure Application maps vulnerabilities directly to the microservices they affect within the Observability Cloud APM service map. The practical upside: security teams can differentiate between vulnerabilities in libraries and genuinely exploitable risks in your production environment — filtering out the noise and prioritising based on real-time exploitability. No additional agents required; it runs within the existing observability instrumentation.
Log Observer Connect: Usability Improvements That Matter
Not every improvement is headline-worthy — but Log Observer Connect received a set of UX changes in June 2025 that practitioners will quietly appreciate:
Default index selection now loads only the most relevant indexes, rather than auto-selecting everything
Filter placement improved for smaller screens
Inline filter editing
A cancel search functionality was also added — simple, but meaningful when you’re trying to reduce SVC consumption mid-investigation.
By February 2026, logs became first-class citizens in the new dashboarding experience, with SPL and SPL2-based log charts available directly in modern dashboards in Splunk Observability Cloud — reduced context switching between Splunk Platform and Observability Cloud.
Cost & Metrics Management: Management Maturity
Metrics Usage Analytics (MUA) — launched in November 2024 and now available across all AWS realms — provides a self-serve reporting interface within Metrics Pipeline Management. You can see how many metric time series (MTS) are generated, used, and stored across your system, and use that data to make archival and aggregation decisions.
Automated Archival arrived in July 2025, giving teams a proactive way to combat the cost growth that inevitably accompanies observability maturity. Archived metrics can be restored when needed — you’re not deleting data, you’re tiering it.
Mobile & RUM: Cumulative Client Context
A few releases that matter for teams with significant mobile footprints:
May 2025: RUM Crash Symbolication for iOS and Android converts memory symbols from stack traces into human-readable code lines. No separate symbolication setup required.
May 2025: SourceMap Support for Browser RUM converts minified JavaScript error stack traces into readable code — uploaded via CI/CD or the UI.
June 2025: Custom tags for Monitoring MetricSets in RUM, and histogram visualisations in Tag Spotlight for front-end metrics like Core Web Vitals.
Early 2026 (Alpha): React Native and Flutter support for RUM — first-class mobile visibility for the two most widely-used hybrid frameworks.
Administration: Unified Identity improvements
The Unified Identity initiative — connecting Splunk Cloud Platform user management with Observability Cloud — reached a milestone in September 2025 with Custom Observability Roles in Splunk Cloud. Administrators can now create roles matching their organisation’s specific personas, with least-privilege permissions across both platforms. All Observability capabilities are now manageable centrally in Splunk Cloud.
What to Watch
A few capabilities currently in Alpha or Preview that are worth tracking:
Business Insights (Alpha, March 2026): Connect application performance to business KPIs — visualise long-running business processes like loan approvals, and understand revenue impact of technical issues in real time.
Database Query Performance for SQL Server (Preview): Deep query execution plan visibility, correlated with APM — the back-and-forth between application and database teams has a new answer.
Enterprise Networking Content Pack (Preview): Cisco Catalyst Center and Meraki integration for campus and branch network visibility — for teams already invested in the Cisco ecosystem, this brings network health into the same observability pane.
The Practitioner’s Take
Splunk Observability Cloud is evolving from a best-in-class infrastructure and APM monitoring platform into something broader — a unified observability and digital intelligence platform that spans infrastructure, applications, AI stacks, security, and user experience.
The AI capabilities, in particular, are moving faster than most practitioners I speak to realise. The gap between “we have an AI assistant” (late 2024) and “we have an autonomous troubleshooting agent that writes your RCA and remediation plan” (early 2026) closed in about 14 months.
For teams planning their observability practice for the next 12-18 months, the questions worth considering are:
Are we using Unified Identity yet? If not, the custom role management you’re missing is significant.
Are our AI workloads instrumented? If you’re running LLMs in production, the AI Agent and Infrastructure Monitoring capabilities are now GA — not a future roadmap item.
Is our RUM implementation capturing enough context for Digital Experience Analytics to be useful? The value of that feature scales with instrumentation quality.
The release cadence shows no sign of slowing. Neither should your attention to it.
Sources: Splunk Observability Cloud Release Notes | Splunk Community Product Announcements | Splunk Blog: Q1 2026 Observability Update | .conf25 Observability Recap